Data·Clicks and coverage
How often do AI Overviews appear, and for which queries?
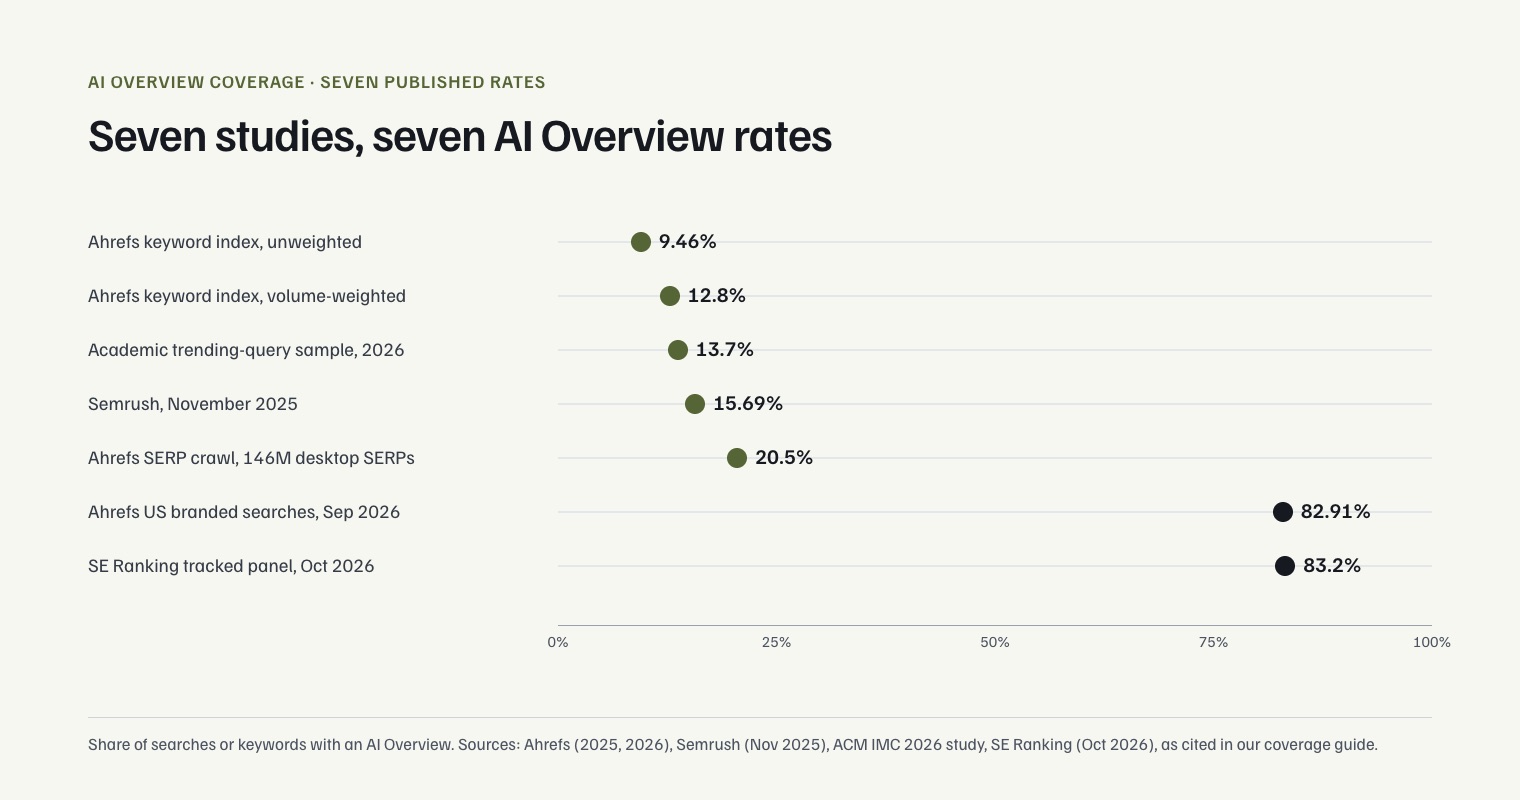
Broad AI Overview studies report very different rates, including 9.46% of indexed desktop keywords, 20.5% of crawled desktop SERPs, and 13.7% of a 2026 academic trending-query sample.
·10 min read·Markdown
On this page
- Which Queries Trigger AI Overviews? Coverage by Industry and Country in 2026
- What percentage of searches trigger AI Overviews?
- Which query types trigger AI Overviews most often?
- How common are AI Overviews by industry?
- How frequently do AI Overviews appear by country?
- What does AI Overview coverage mean for publishers and brands?
- How should AI Overview prevalence be measured?
- FAQ
- Sources
Summarize with ChatGPTClaudePerplexity
TL;DR
- Broad AI Overview studies report very different rates, including 9.46% of indexed desktop keywords, 20.5% of crawled desktop SERPs, and 13.7% of a 2026 academic trending-query sample.[1][2]
- Question-form searches trigger AI Overviews more often than non-question searches in multiple datasets, including 57.9% versus 15.5% in Ahrefs’ analysis.[2]
- Industry coverage varies by panel and date: BrightEdge reported 85.2% for Education and 83.6% for Healthcare, while SE Ranking reported 96% for Business and Technology in September 2026.[12][3]
- Ahrefs reported country-level keyword prevalence of 16.5% in India, 16.0% in the United States, 15.5% in Brazil, and 12.5% in the United Kingdom.[1]
- Google availability announcements describe where AI Overviews can appear, but they do not establish a universal country-by-country trigger rate.[6]
Which Queries Trigger AI Overviews? Coverage by Industry and Country in 2026
Google AI Overviews do not appear at one stable rate. Published studies report anything from 9.46% of indexed desktop keywords to more than 80% in selected commercial or branded panels, because they measure different queries, countries, dates, and denominators.[1]
This guide separates those measurements instead of presenting a single “AI Overviews frequency” figure. It compares prevalence by query type, industry, and country, then explains how to interpret the differences.
What percentage of searches trigger AI Overviews?
There is no single defensible market-wide trigger rate. Broad studies report substantially different results: Semrush recorded 15.69% in November 2025, Ahrefs found AI Overviews on 20.5% of 146 million desktop SERPs, and a 2026 academic study measured 13.7% across trending queries.[2]
Selected commercial and branded panels show much higher coverage. SE Ranking reported 83.2% for its tracked panel in October 2026, while Ahrefs found AI Overviews on 82.91% of US desktop branded-search results on 29 September 2026.[3]
These figures are not contradictory estimates of the same population. They answer different questions:
| Measurement type | Reported result | What it measures |
|---|---|---|
| Large keyword index | 9.46% unweighted; 12.8% search-volume weighted | Keywords in Ahrefs’ desktop index with an AI Overview |
| Large SERP crawl | 20.5% | Desktop SERPs containing an AI Overview |
| Trending-query academic sample | 13.7% | Activation across 55,393 trending queries |
| Commercial modifier panel | 82.05%–96.12% | Selected US desktop searches in banking, software, and ecommerce |
| Branded-query panel | 82.91% on 29 September 2026 | US desktop branded searches |
| Commercial tracked panel | 83.2% in October 2026 | SE Ranking’s tracked keyword panel |
The Ahrefs keyword study counted 55.8 million AI Overview results across 590 million desktop keywords, producing a 9.46% unweighted rate and a 12.8% search-volume-weighted rate.[1] The distinction matters: a keyword-weighted rate treats each keyword equally, while a search-volume-weighted rate gives greater influence to frequently searched terms.
Five findings from the prevalence data
- Broad-query prevalence is usually much lower than selected commercial coverage. Large mixed-query datasets report roughly 9%–21%, while selected commercial-modifier studies report more than 80%.[4]
- AIO coverage has changed over time. Semrush reported 6.49% in January 2025, 24.61% in July, and 15.69% in November for its tracked series.[5]
- The observation period can change the result dramatically. SE Ranking reported 28.66% in May 2025, a peak of 84.16% in September 2026, and 83.2% in October 2026.[3][6]
- Branded searches can have especially high coverage. Ahrefs reported monthly branded-keyword averages of 61.3% in July, 65.1% in August, and 73.3% in September 2026.[7]
- No study cited here provides an official Google-wide trigger rate for every search. Each result comes from a defined keyword list, crawl, panel, or query sample.[8][3]
Which query types trigger AI Overviews most often?
Question-form and longer searches are consistently associated with higher AI Overview coverage, although the exact rate depends on the dataset. Ahrefs found AI Overviews on 57.9% of question-query SERPs compared with 15.5% of non-question-query SERPs.[2]
A 2026 academic measurement study found activation for 64.7% of question-form queries.[9][10] The two percentages should be treated as directional evidence rather than combined, because the studies used different query sets and collection periods.
| Query characteristic | Reported AI Overview coverage | Interpretation |
|---|---|---|
| Question queries | 57.9% | Ahrefs’ question-query SERPs |
| Non-question queries | 15.5% | Ahrefs’ comparison group |
| Question-form queries | 64.7% | 2026 academic study |
| Four-word searches | 25.82% | SE Ranking tracked panel |
| Ten-word searches | 69.21% | SE Ranking tracked panel |
| “Best X for Y” queries | 96.12% | Selected US commercial panel |
| Review queries | 90% | Selected US commercial panel |
SE Ranking reported AI Overviews on 69.21% of ten-word searches compared with 25.82% of four-word searches.[3] Longer queries often provide more context and resemble natural-language questions, but this does not mean every long-tail query triggers an Overview.
Commercial modifiers can produce much higher rates than broad query sets. In Semrush’s US desktop study of banking, software, and ecommerce keywords, “Best X for Y” searches reached 96.12% coverage and review queries reached 90% in August 2026.[8]
The same study reported coverage above 86% for brand-versus-brand searches and above 82% for alternatives.[8] These results apply to the selected panel, not to all commercial searches.
Informational, commercial, and transactional intent
Informational searches make up a large share of the queries that trigger AI Overviews, but that statistic should not be confused with an informational trigger probability. Semrush reported that informational searches represented 91.3% of AIO-triggering queries in January 2025 and 57.1% in October.[5]
This is a composition measure: it tells readers what proportion of triggering queries were informational. It does not tell readers what percentage of all informational searches received an Overview.
Other studies show that commercial coverage has expanded. Semrush reported a 71% increase in AI Overview presence in commercial SERPs between November 2025 and April 2026, while transactional SERP presence fell by 5%.[11] Finance recorded the largest reported commercial-intent increase at 231.25%.[11]
BrightEdge’s examples show a similar intent hierarchy. It reported 60%–85% coverage for queries such as “what is,” “how does,” medical definitions, symptoms, technical documentation, educational concepts, and non-transactional comparisons, while “buy X online,” local commercial searches, direct brand navigation, and pure transactional queries were generally below 20%.[12]
How common are AI Overviews by industry?
Industry coverage varies sharply by provider, date, and query panel. Science and health ranked highly in several 2025 datasets, while late-2026 SE Ranking data reported especially high coverage in business, technology, finance, relationships, and education.[2][3]
| Industry or category | Study and period | Reported coverage |
|---|---|---|
| Science | Semrush, November 2025 | 25.96% |
| Computers and Electronics | Semrush, November 2025 | 17.92% |
| People and Society | Semrush, November 2025 | 17.29% |
| Real Estate | Semrush, November 2025 | Below 3% |
| Shopping | Semrush, November 2025 | Below 3% |
| Education | BrightEdge, September 2025 | 85.2% |
| Healthcare | BrightEdge, September 2025 | 83.6% |
| Entertainment | BrightEdge, September 2025 | 45.9% |
| Finance | BrightEdge, September 2025 | 17.9% |
| Ecommerce | BrightEdge, September 2025 | 18.5% |
| Science | Ahrefs, September 2025 | 43.6% |
| Health | Ahrefs, September 2025 | 43.0% |
| Pets and Animals | Ahrefs, September 2025 | 36.8% |
| People and Society | Ahrefs, September 2025 | 35.3% |
| Shopping | Ahrefs, September 2025 | 3.2% |
| Real Estate | Ahrefs, September 2025 | 5.8% |
| Business | SE Ranking, September 2026 | 96% |
| Technology | SE Ranking, September 2026 | 96% |
| Finance | SE Ranking, September 2026 | 93% |
| Relationships | SE Ranking, September 2026 | 93% |
| Education | SE Ranking, September 2026 | 92% |
| Ecommerce and Retail | SE Ranking, September 2026 | 79% |
| Real Estate | SE Ranking, September 2026 | 81% |
| Fashion and Beauty | SE Ranking, September 2026 | 60% |
The biggest apparent disagreement is Finance: BrightEdge reported 17.9% in its September 2025 industry breakdown, while SE Ranking reported 93% in September 2026.[12] Those figures should not be averaged or presented as a single industry benchmark. They come from different periods, panels, query mixes, and likely measurement designs.
Why industry percentages differ
Industry-level AIO coverage can change because of:
- The proportion of questions, comparisons, and definitions in the keyword set.
- The share of branded, commercial, and transactional queries.
- Country and language settings.
- Desktop versus mobile measurement.
- The date of the crawl.
- Whether results are weighted by keywords or search volume.
- How each provider classifies industries and detects an Overview.
A finance panel dominated by “best,” “compare,” or “alternatives” searches may produce a very different result from a finance panel dominated by bank names, login terms, or product navigation. The reported percentage therefore describes the panel, not an immutable property of the industry.[8]
How frequently do AI Overviews appear by country?
Country-level prevalence data is more limited than query- or industry-level data. Ahrefs reported AI Overview prevalence of 16.5% in India, 16.0% in the United States, 15.5% in Brazil, and 12.5% in the United Kingdom in its 2025 desktop keyword index.[1]
| Country | Reported prevalence | Measurement |
|---|---|---|
| India | 16.5% | Ahrefs desktop keyword index |
| United States | 16.0% | Ahrefs desktop keyword index |
| Brazil | 15.5% | Ahrefs desktop keyword index |
| United Kingdom | 12.5% | Ahrefs desktop keyword index |
Ahrefs stated that its US figure represented 24.9 million of 156 million indexed US search terms.[1] These are vendor-index keyword rates, not official country-wide rates for all Google searches. The index also underrepresents low-volume and one-off searches.[1]
Availability is not the same as prevalence
Google’s availability announcements describe where AI Overviews can be shown, not how often they appear for every query. Google announced in May 2025 that AI Overviews had expanded to more than 200 countries and territories and more than 40 languages.[3]
Google’s European rollout announcement listed Austria, Belgium, Germany, Ireland, Italy, Poland, Portugal, Spain, and Switzerland, with combinations of local languages and English.[13]
| Country | Languages listed in Google’s European announcement |
|---|---|
| Austria | German and English |
| Belgium | English |
| Germany | German and English |
| Ireland | English |
| Italy | Italian and English |
| Poland | Polish and English |
| Portugal | Portuguese and English |
| Spain | Spanish and English |
| Switzerland | French, German, Italian, and English |
Google’s official pages are not fully consistent on the current total. The dated expansion announcement says more than 200 countries and territories and more than 40 languages, while an undated product page says 120-plus countries and territories and 11 languages.[3]
The cited official pages do not publish a consistent, complete November 2026 country-language matrix. Availability should therefore be reported separately from observed trigger frequency.[2]
How to read an AI Overview country statistic
A country statistic should identify the provider, query set, device type, observation period, language, and denominator. “AI Overviews appear in 16% of US searches” is incomplete unless it specifies whether the figure describes indexed keywords, crawled SERPs, search-volume-weighted queries, or a selected commercial panel.[8]
What does AI Overview coverage mean for publishers and brands?
Coverage data indicates where Google may summarize information directly in the search results, but it does not by itself measure clicks, citations, traffic, conversions, or revenue. A high trigger rate can mean that a topic is frequently answered within the search interface; it does not establish how users behave afterward. Downstream outcomes are also hard to measure: Finseo’s own review of AI search attribution reports that analytics records about 1 in 10 AI-driven conversions.
The practical implications differ by query class:
- Informational publishers should monitor question coverage. Question-form queries show higher activation in both commercial and academic studies.[4]
- Commercial brands should segment modifiers. “Best,” review, comparison, alternatives, and brand-versus-brand queries can have much higher coverage than generic mixed-query datasets.[8]
- Local and transactional businesses should avoid broad assumptions. BrightEdge reported lower coverage for local commercial and pure transactional examples than for research-oriented queries.[12]
- International teams should measure each market separately. Country availability does not reveal country-specific prevalence, and vendor-index rates differ by market.[4]
- Trend lines need stable methodology. A change may reflect a different query panel, device, weighting method, or classification rather than a Google-wide change.[14][6]
For tracking, the minimum useful dashboard should preserve the query, country, language, device, date, intent, industry, and whether the result contained an Overview. It should also distinguish brand, competitor, and non-brand queries, because branded coverage can be substantially higher than broad-query coverage.[8]
How should AI Overview prevalence be measured?
A credible prevalence report should make the denominator explicit. The following framework keeps unlike measurements separate:
| Measurement question | Appropriate denominator |
|---|---|
| How often do indexed keywords trigger an Overview? | Number of indexed keywords |
| How often do SERPs contain an Overview? | Number of crawled SERPs |
| How often do users encounter an Overview? | Search-volume-weighted query set |
| How common are Overviews for a vertical? | A defined industry keyword panel |
| How common are Overviews in a country? | A country-specific, language-specific query panel |
| How often do commercial queries trigger one? | A clearly defined commercial-intent panel |
A practical measurement checklist
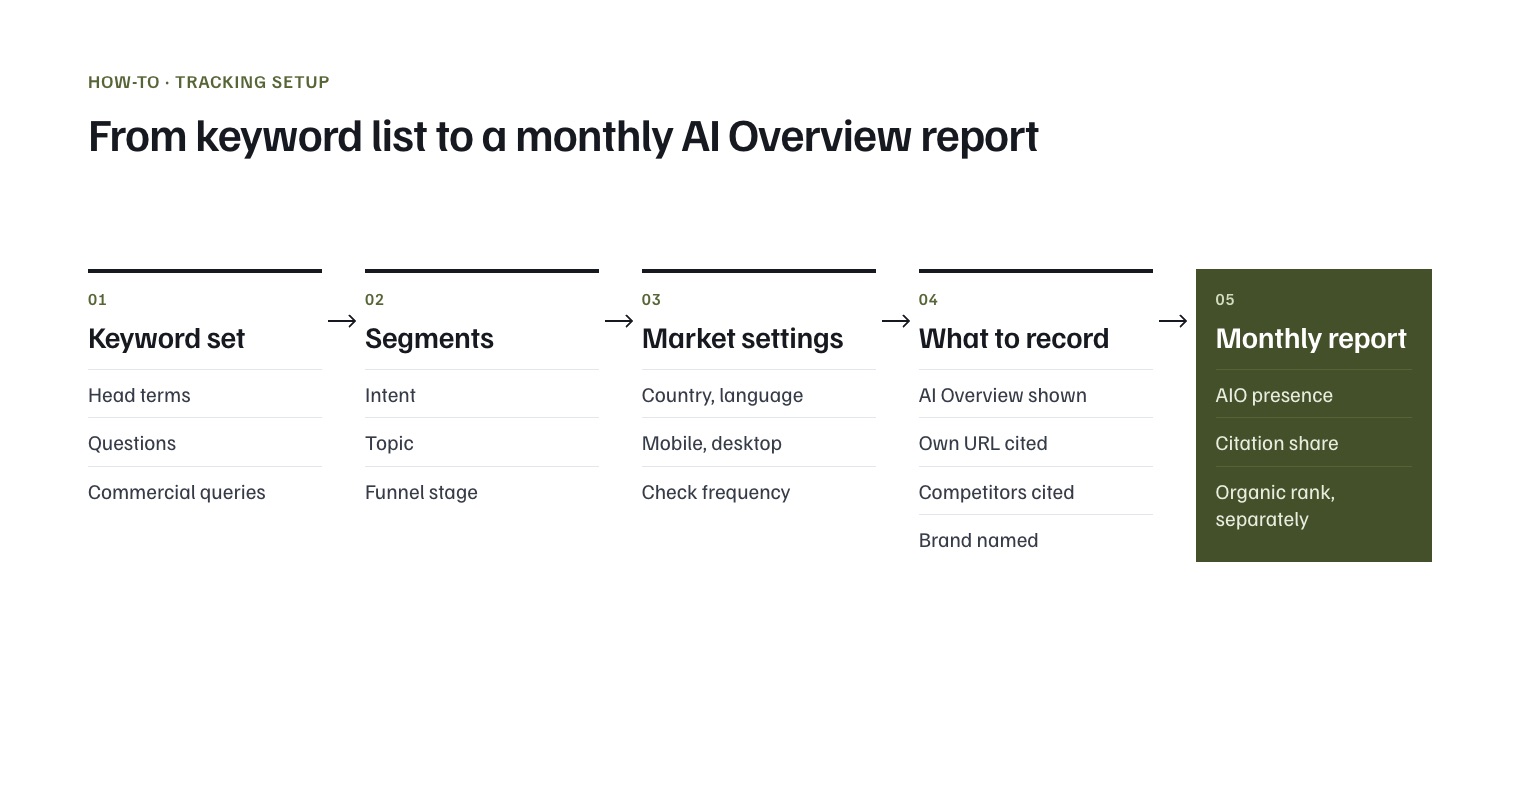
- Record the collection date and comparison period.
- State the country, language, and device.
- Report the number of queries or SERPs.
- Define whether each query is weighted equally.
- Separate branded from non-branded searches.
- Separate question, informational, commercial, transactional, and navigational intent.
- Keep industry classifications consistent between reporting periods.
- Report missing or unavailable country data as “Not published.”
- Do not combine rates from different studies into an average.
- Recheck results after major Google rollout changes.
The 2026 academic study is useful as an independent reference point because it measured 55,393 trending queries across 19 topical categories and reported 13.7% overall activation.[9][10] It still does not represent every Google search, because its sample, query source, and collection period are defined rather than universal.
Frequently asked questions
How often do Google AI Overviews appear?
Broad studies report very different rates depending on the sample. Ahrefs measured 20.5% of 146 million desktop SERPs in September 2025, while its separate keyword study reported 9.46% of indexed desktop keywords, or 12.8% when weighted by search volume.[1][2]
Which queries are most likely to trigger AI Overviews?
Question-form and longer queries are among the strongest recurring patterns. Ahrefs reported 57.9% coverage for question queries versus 15.5% for non-question queries, while SE Ranking reported 69.21% for ten-word searches versus 25.82% for four-word searches.[3][2]
Which industries have the highest AI Overview coverage?
The answer depends on the study. BrightEdge reported Education at 85.2% and Healthcare at 83.6% in September 2025, while Ahrefs reported Science at 43.6% and Health at 43.0% in its September 2025 SERP study.[12]
Which country has the highest AI Overview frequency?
In Ahrefs’ cited 2025 desktop keyword data, India had the highest reported prevalence among the four listed markets at 16.5%, followed by the United States at 16.0%, Brazil at 15.5%, and the United Kingdom at 12.5%.[1][4]
Are AI Overviews available in every country?
Google announced availability in more than 200 countries and territories and more than 40 languages in May 2025.[3] However, another official Google page gives a different undated count of 120-plus countries and territories and 11 languages, so the cited official pages do not provide one consistent current country-language total.[1][15]
Do commercial searches trigger AI Overviews?
Some commercial query groups have very high coverage. Semrush reported 96.12% for “Best X for Y” queries and 90% for review queries in a selected US desktop panel covering banking, software, and ecommerce.[8]
Sources
- 1Insights From 55.8M AI Overviews Across 590M Searches—A Study by Ahrefs — ahrefs.com
- 2What Triggers AI Overviews? 86 Factors and 146 Million SERPs Analyzed — ahrefs.com
- 3Google's AI Overviews: Updates and changes from SGE to 2026 — seranking.com
- 4The Rise of AI Search: Implications for Information Markets and Human Judgement at Scale — arxiv.org
- 5Semrush Report: AI Overviews’ Impact on Search in 2025 — semrush.com
- 6AI Overviews at the One-Year Mark: Presence, Size, and What They’re Citing | BrightEdge — brightedge.com
- 7AI Overviews Currently Appear for 83% of Branded Searches — ahrefs.com
- 8AI Overviews have nearly doubled across five commercial search modifiers [Study] — semrush.com
- 9[2605.14021] Measuring Google AI Overviews: Activation, Source Quality, Claim Fidelity, and Publisher Impact — arxiv.org
- 10Measuring Google AI Overviews: Activation, Source Quality, Claim Fidelity, and Publisher Impact | Proceedings of the 2026 ACM Internet Measurement Conference — dl.acm.org
- 11AI Overviews are expanding across commercial intent search [Study] — semrush.com
- 12Google's AI Overview Rollout Reveals Clear Intent Hierarchy—Here's What Gets Coverage and What Doesn't | BrightEdge — help.brightedge.com
- 13AI Overviews Europe: 9 New Countries, 4 New Languages — blog.google
- 14Investigating Click Behaviors On Google Search Result Pages That Produce an AI Overview — arxiv.org
- 15Find information in faster & easier ways with AI Overviews in Google Search - Computer - Google Search Help — support.google.com